Ongoing research · Project 01

Numerical study of resonant cavitation-bubble-pair dynamics.

An independent investigation of interacting cavitation bubbles, high-speed microjet formation, and synthetic optical diagnostics.

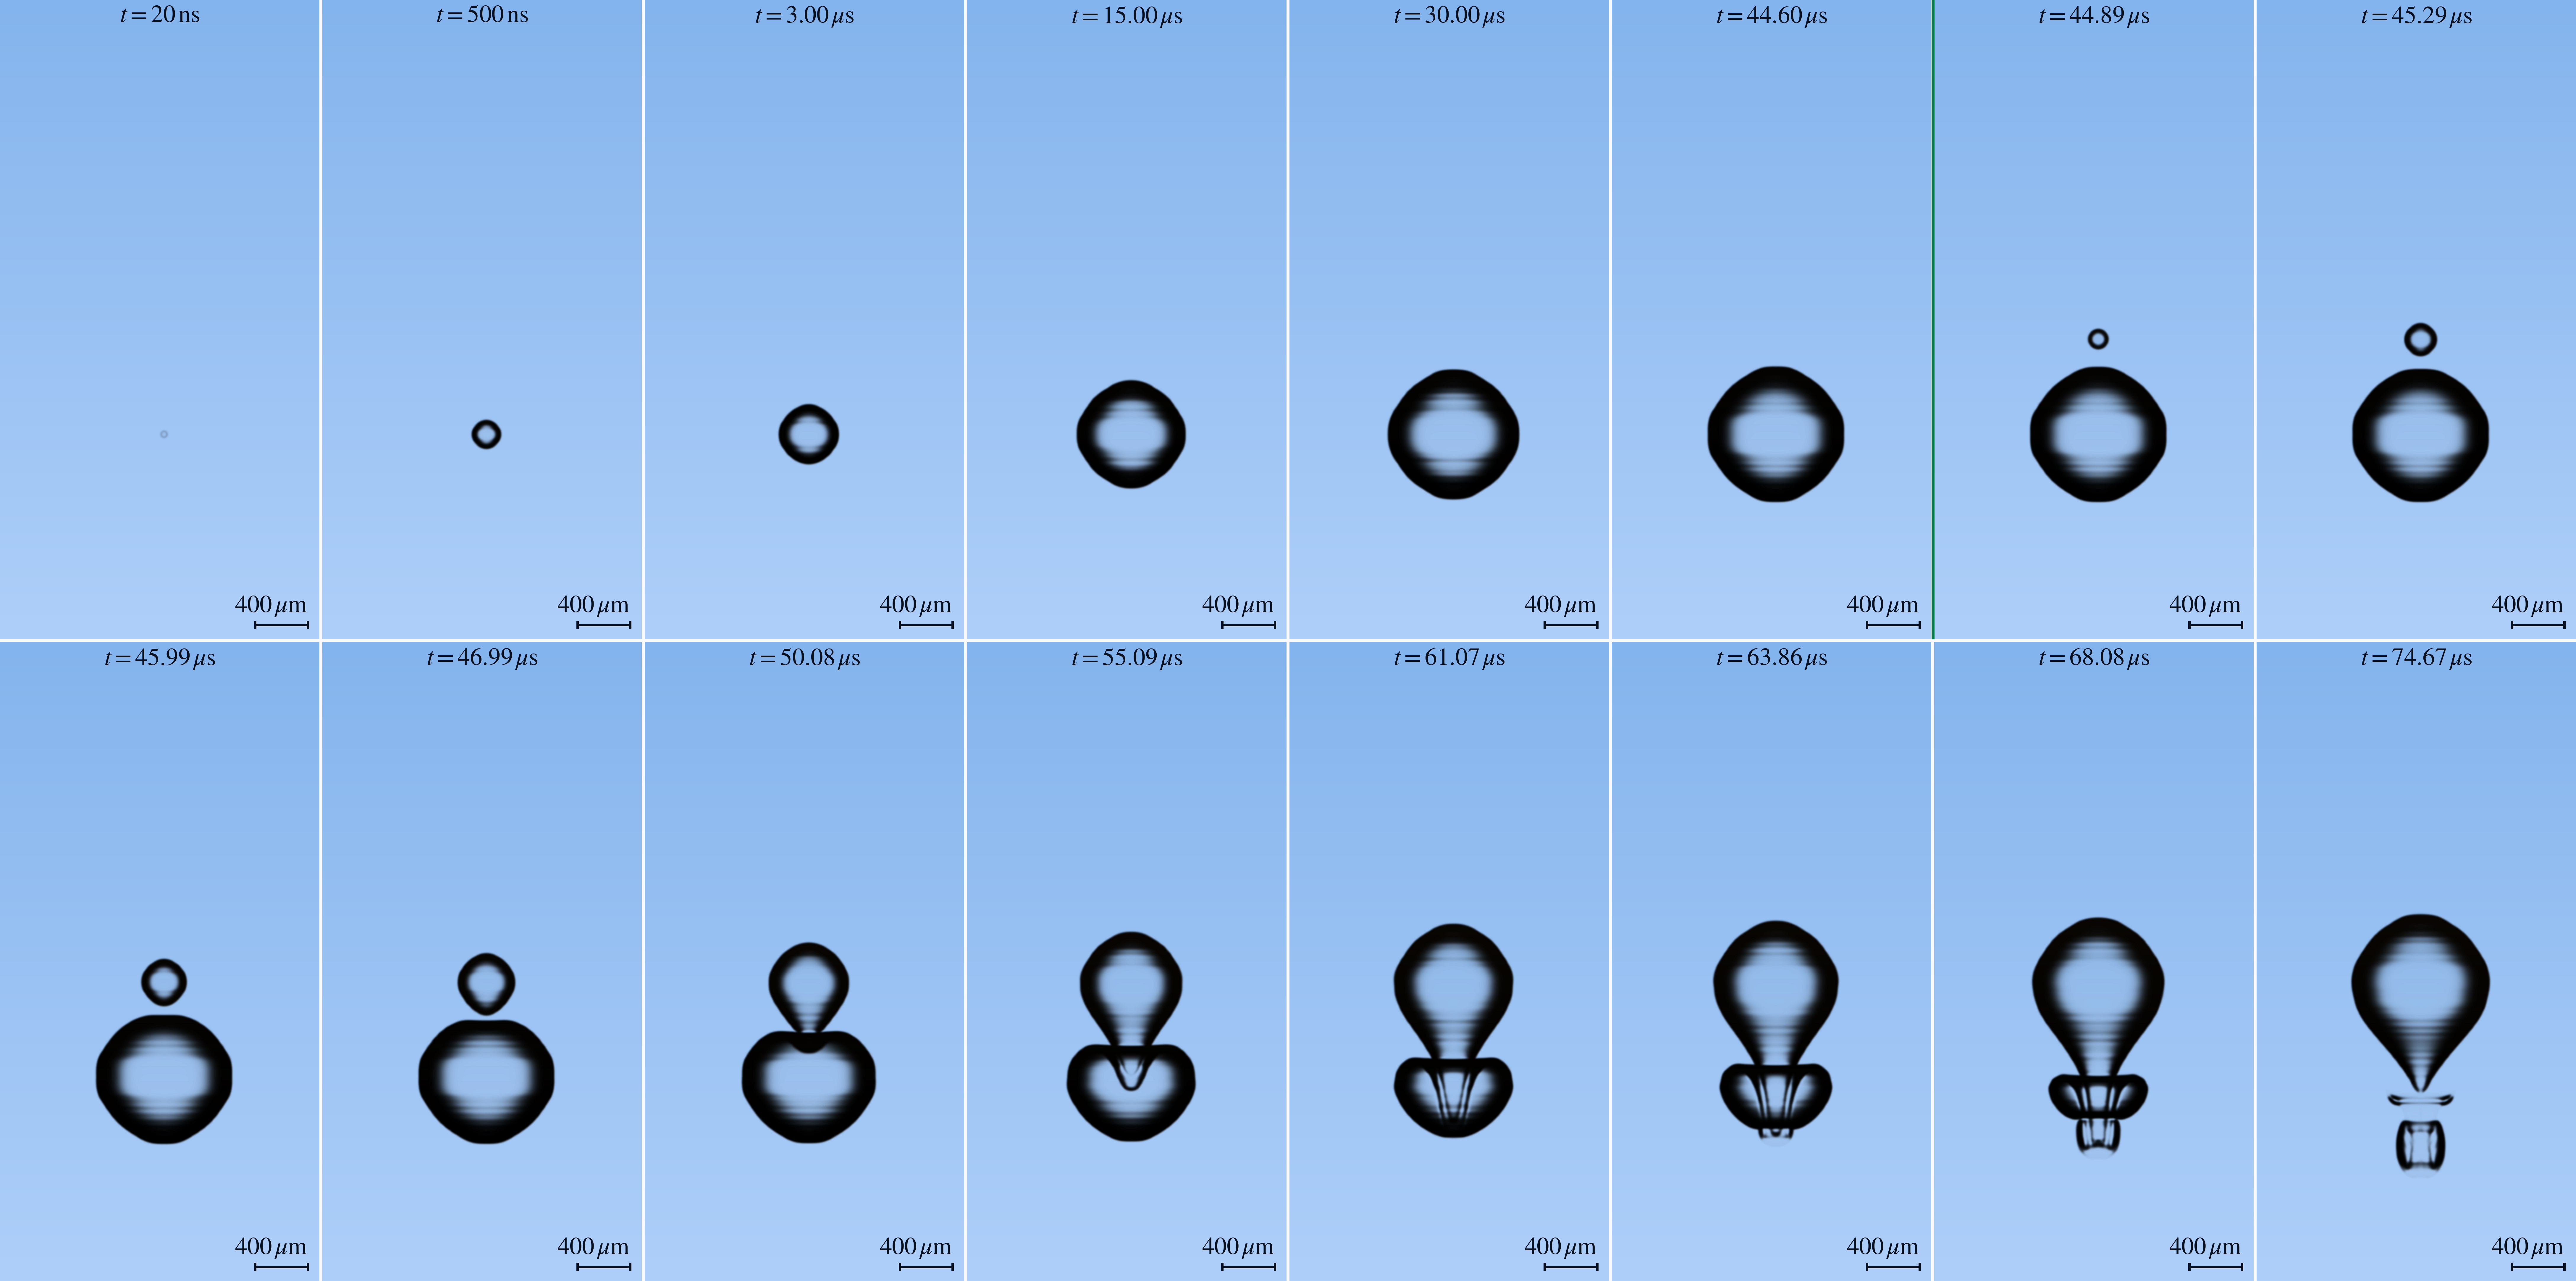
Numerical simulation of an antiphase cavitation-bubble pair, from initial bubble formation through coupled collapse and jet development. Synthetic optical visualization—not experimental footage. Scale bar: 400 µm.

Current project

Resonant cavitation-bubble-pair dynamics

This ongoing study investigates the interaction of two antiphase cavitation bubbles and the subsequent formation of a high-speed liquid microjet. The numerical configuration is inspired by the work of Fan et al., who demonstrated that carefully timed cavitation-bubble pairs can generate supersonic microjets.

The displayed video is a synthetic optical visualization of the numerical results, inspired by state-of-the-art ultrafast cavitation imaging. Technical details of the synthetic optical diagnostic will be made available in a forthcoming publication.

Software

The simulation was performed using a privately developed research codebase.
Matched diagnostics · 16 physical instants

One event sequence, viewed four ways.

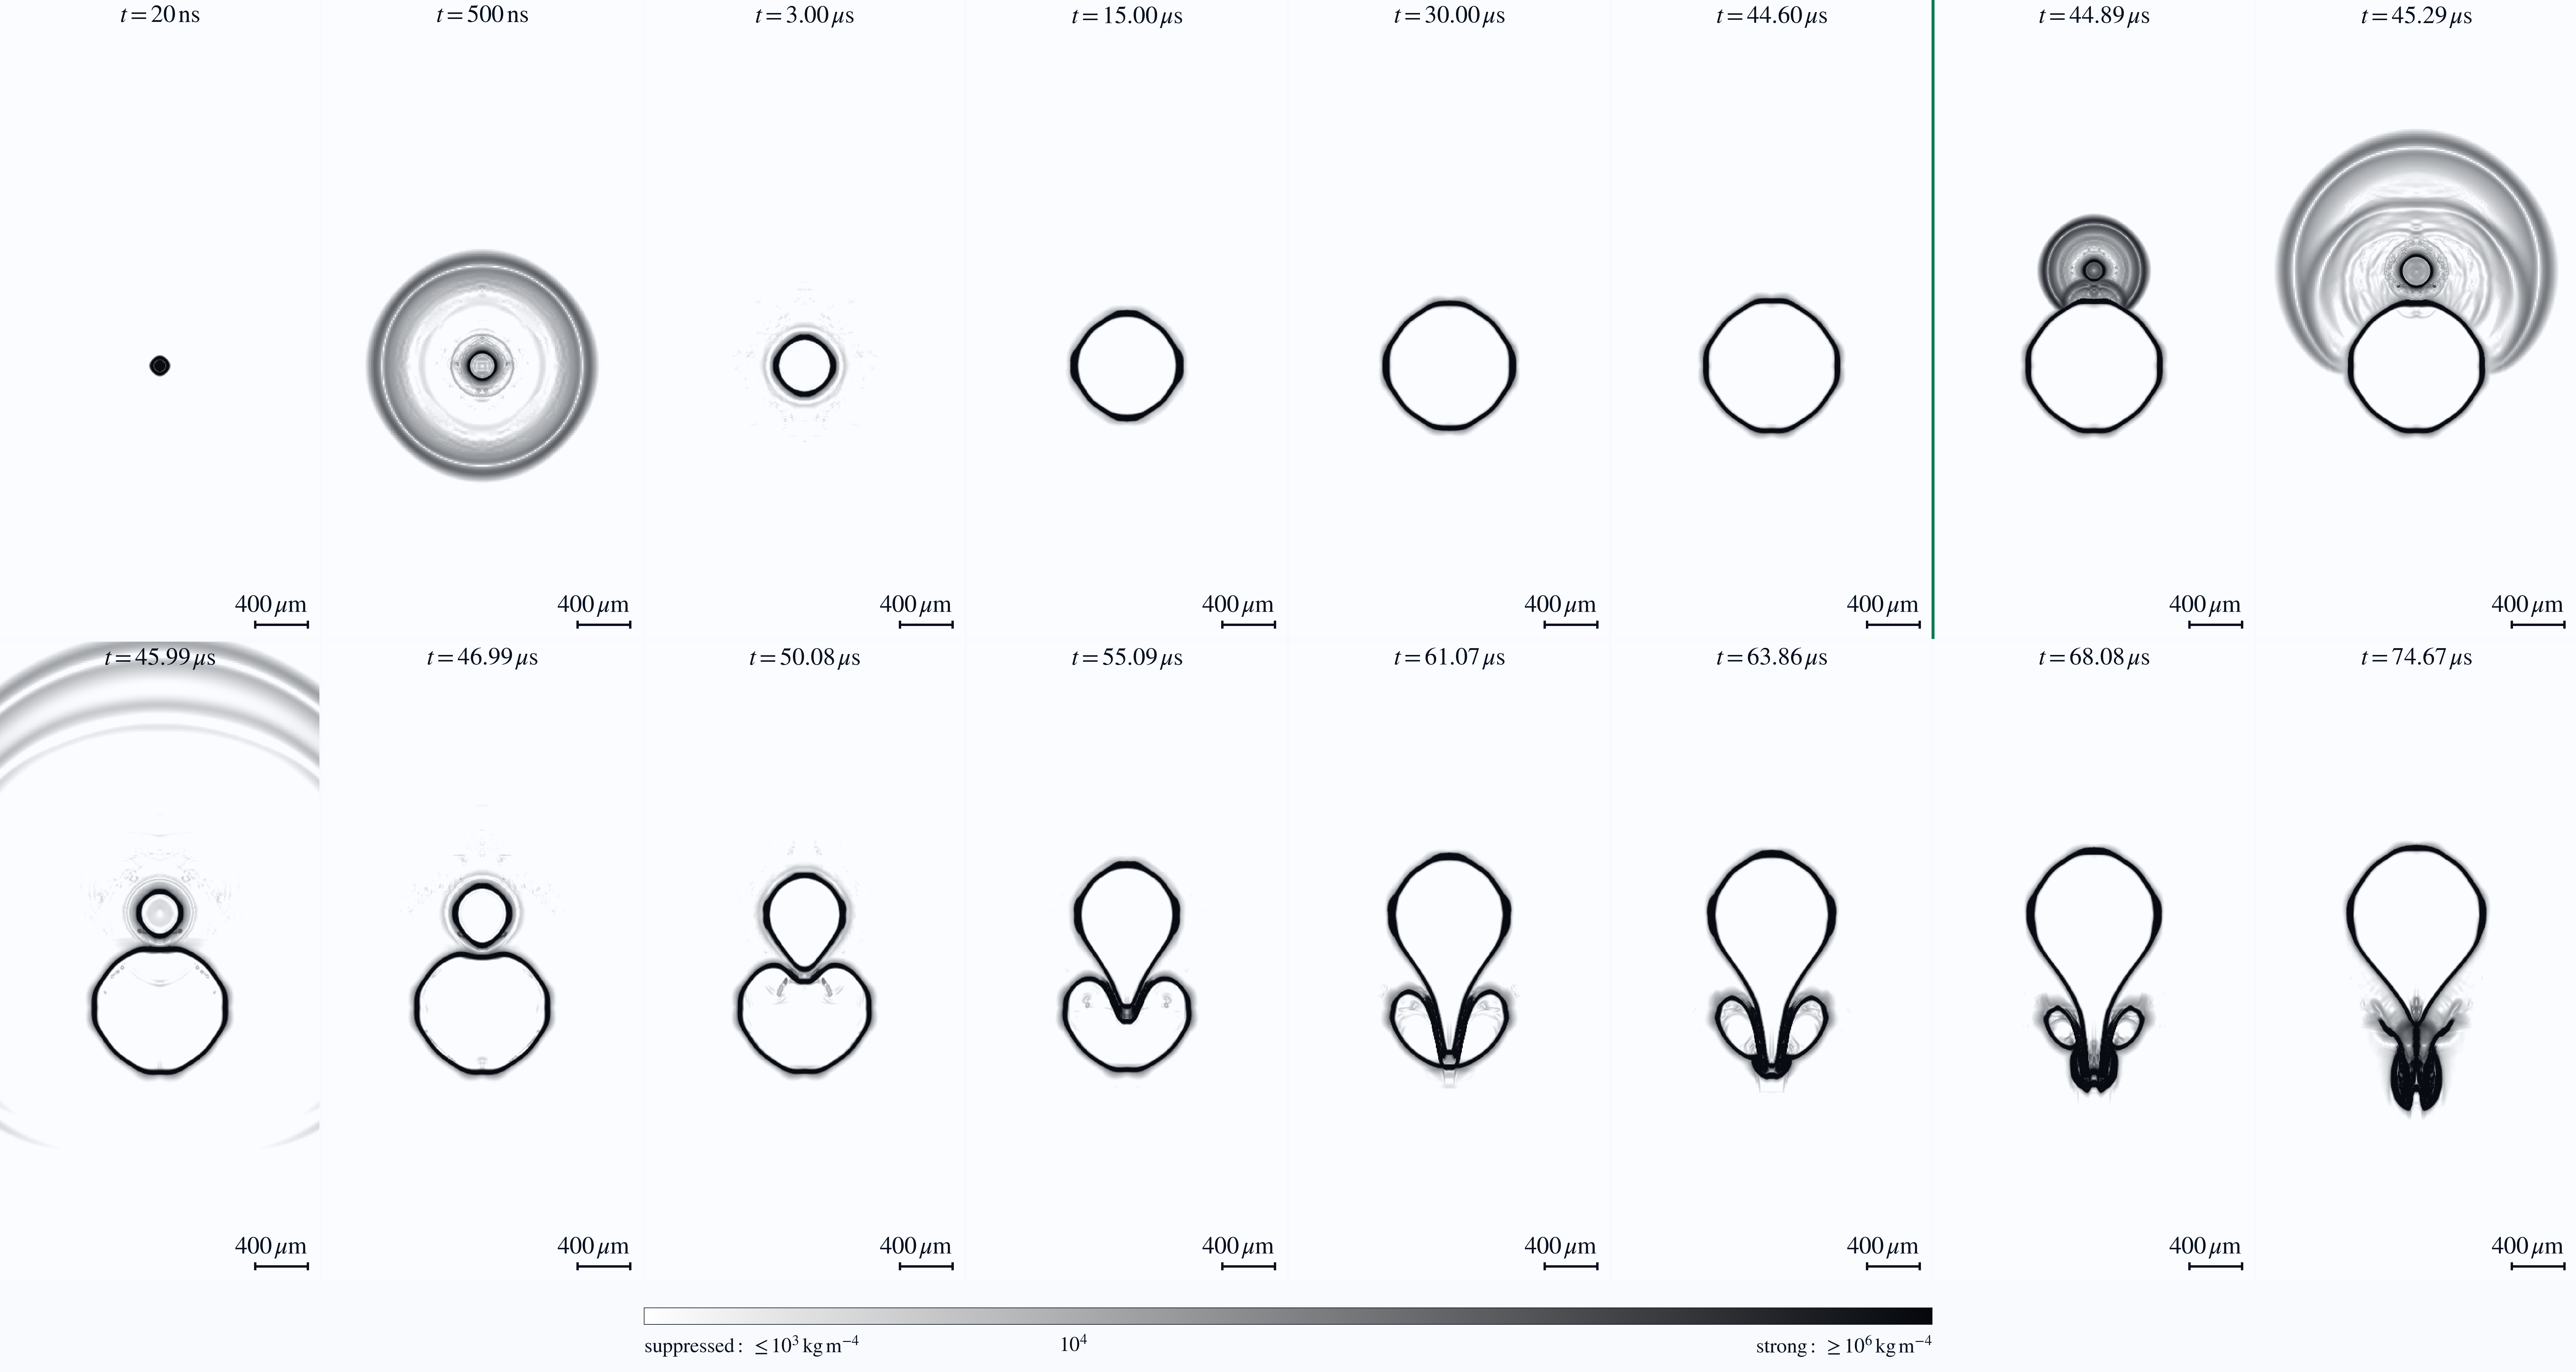
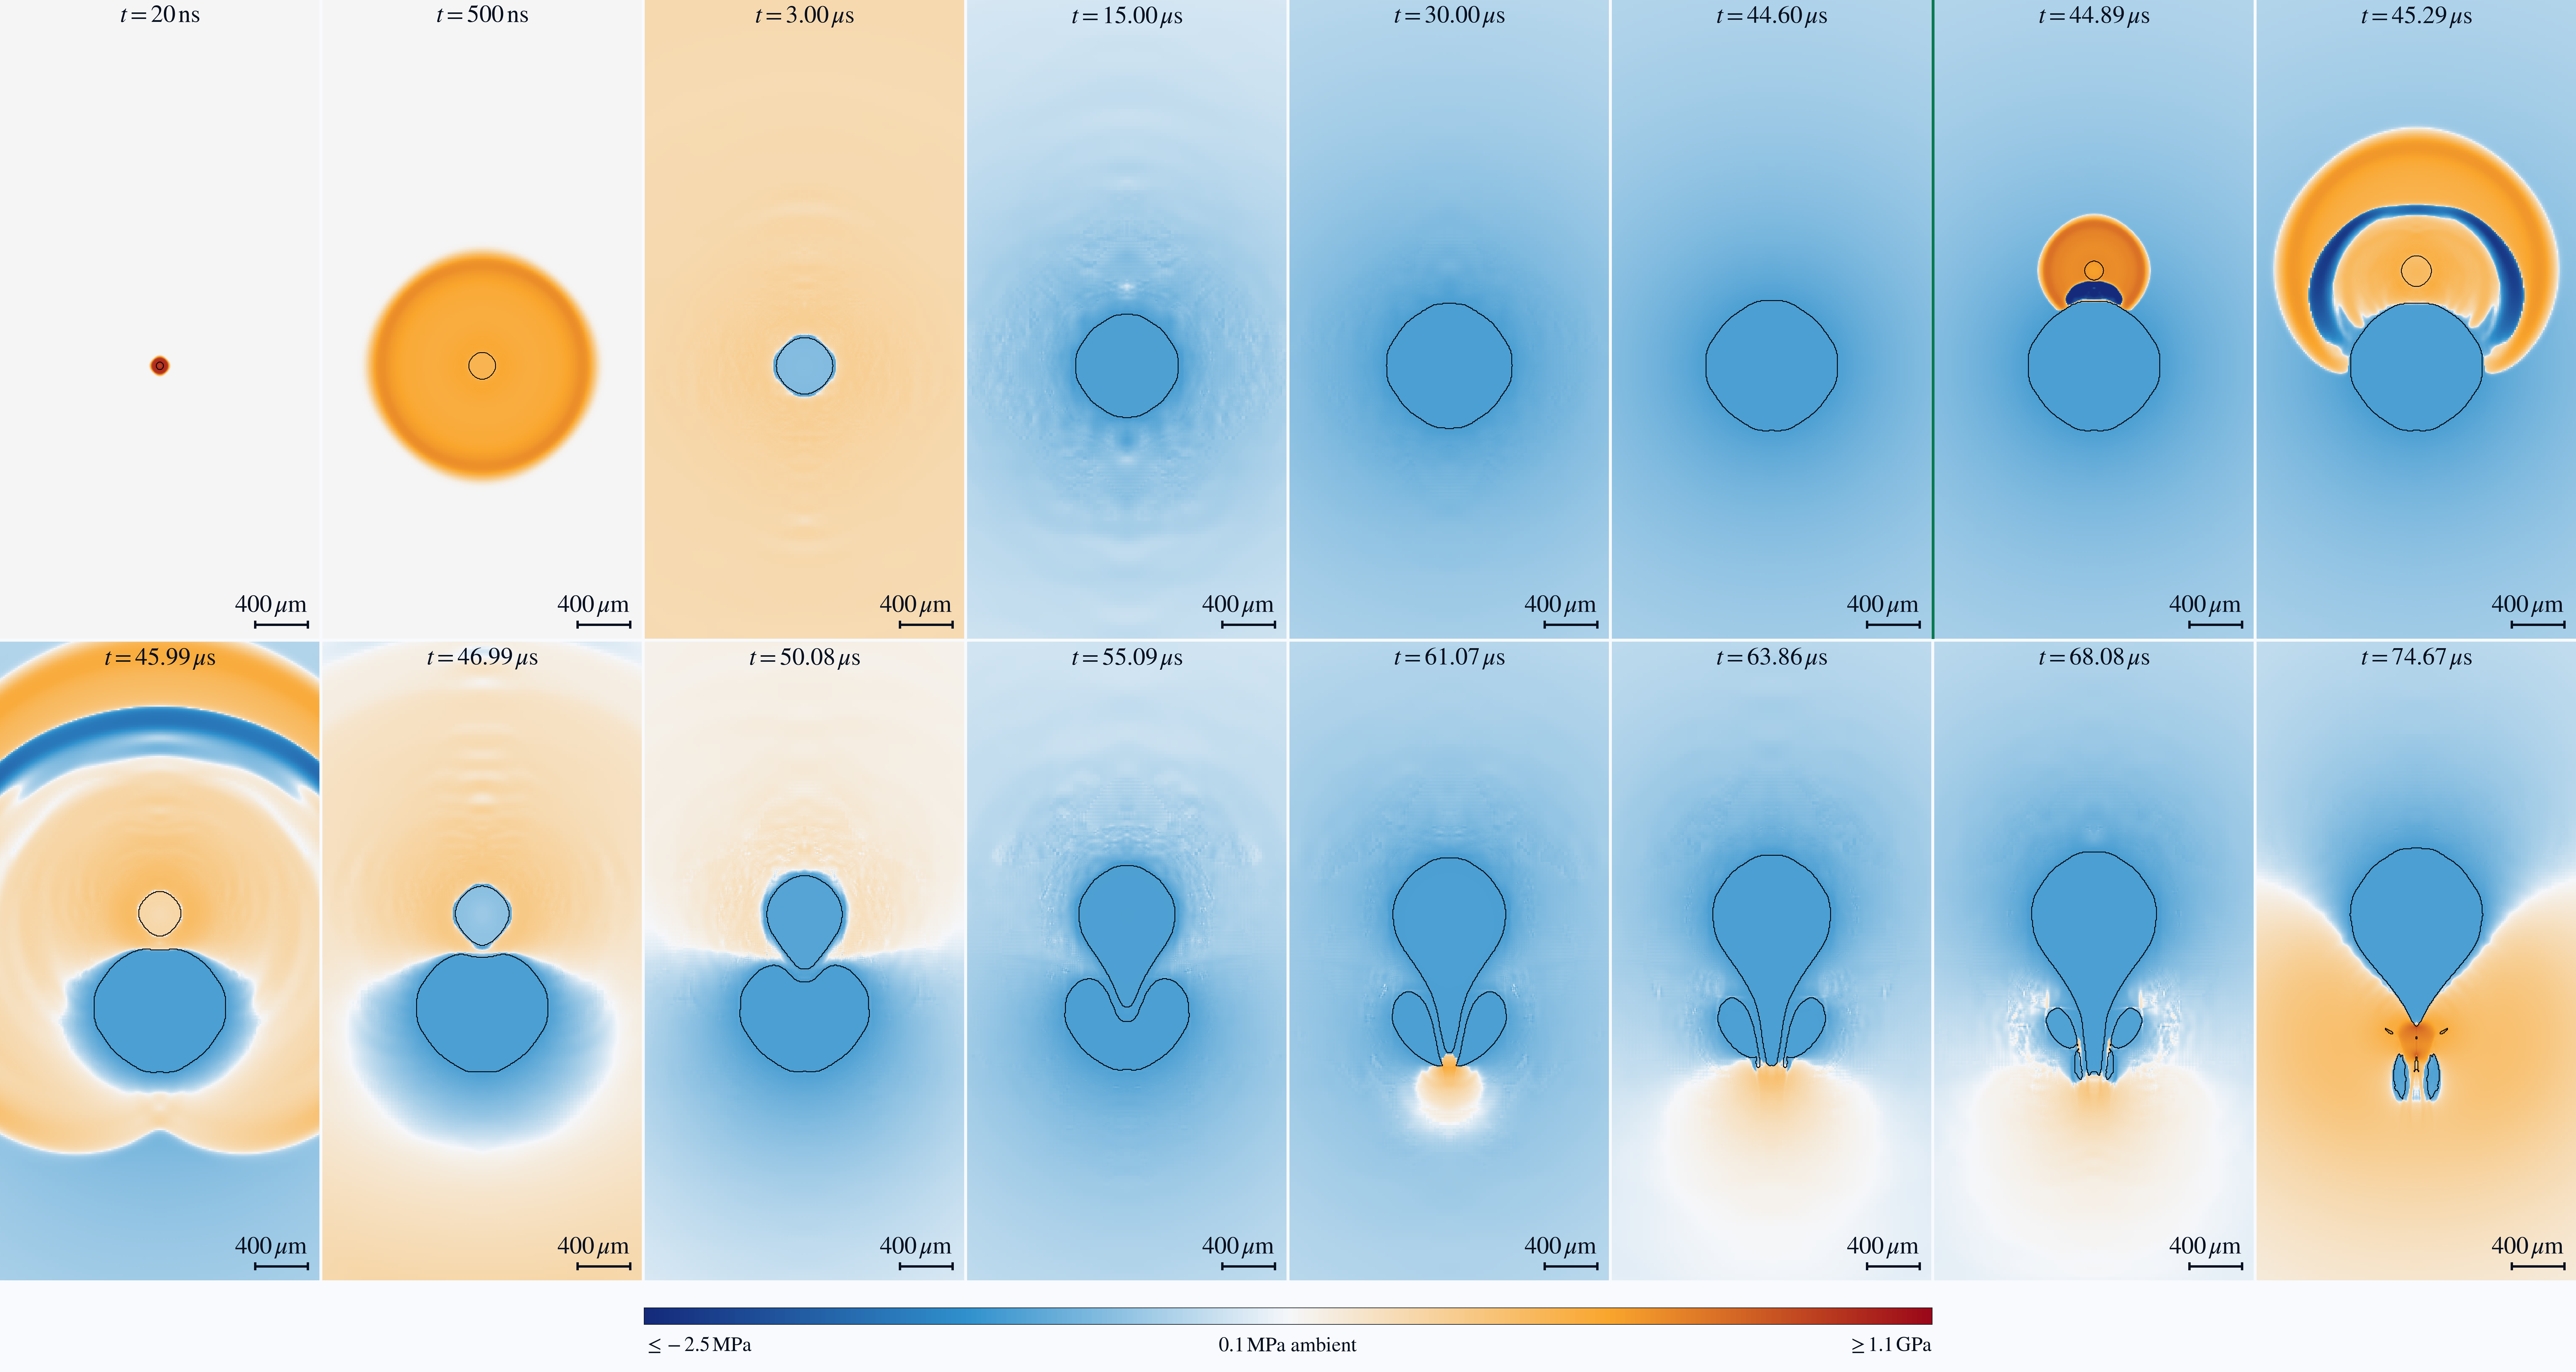
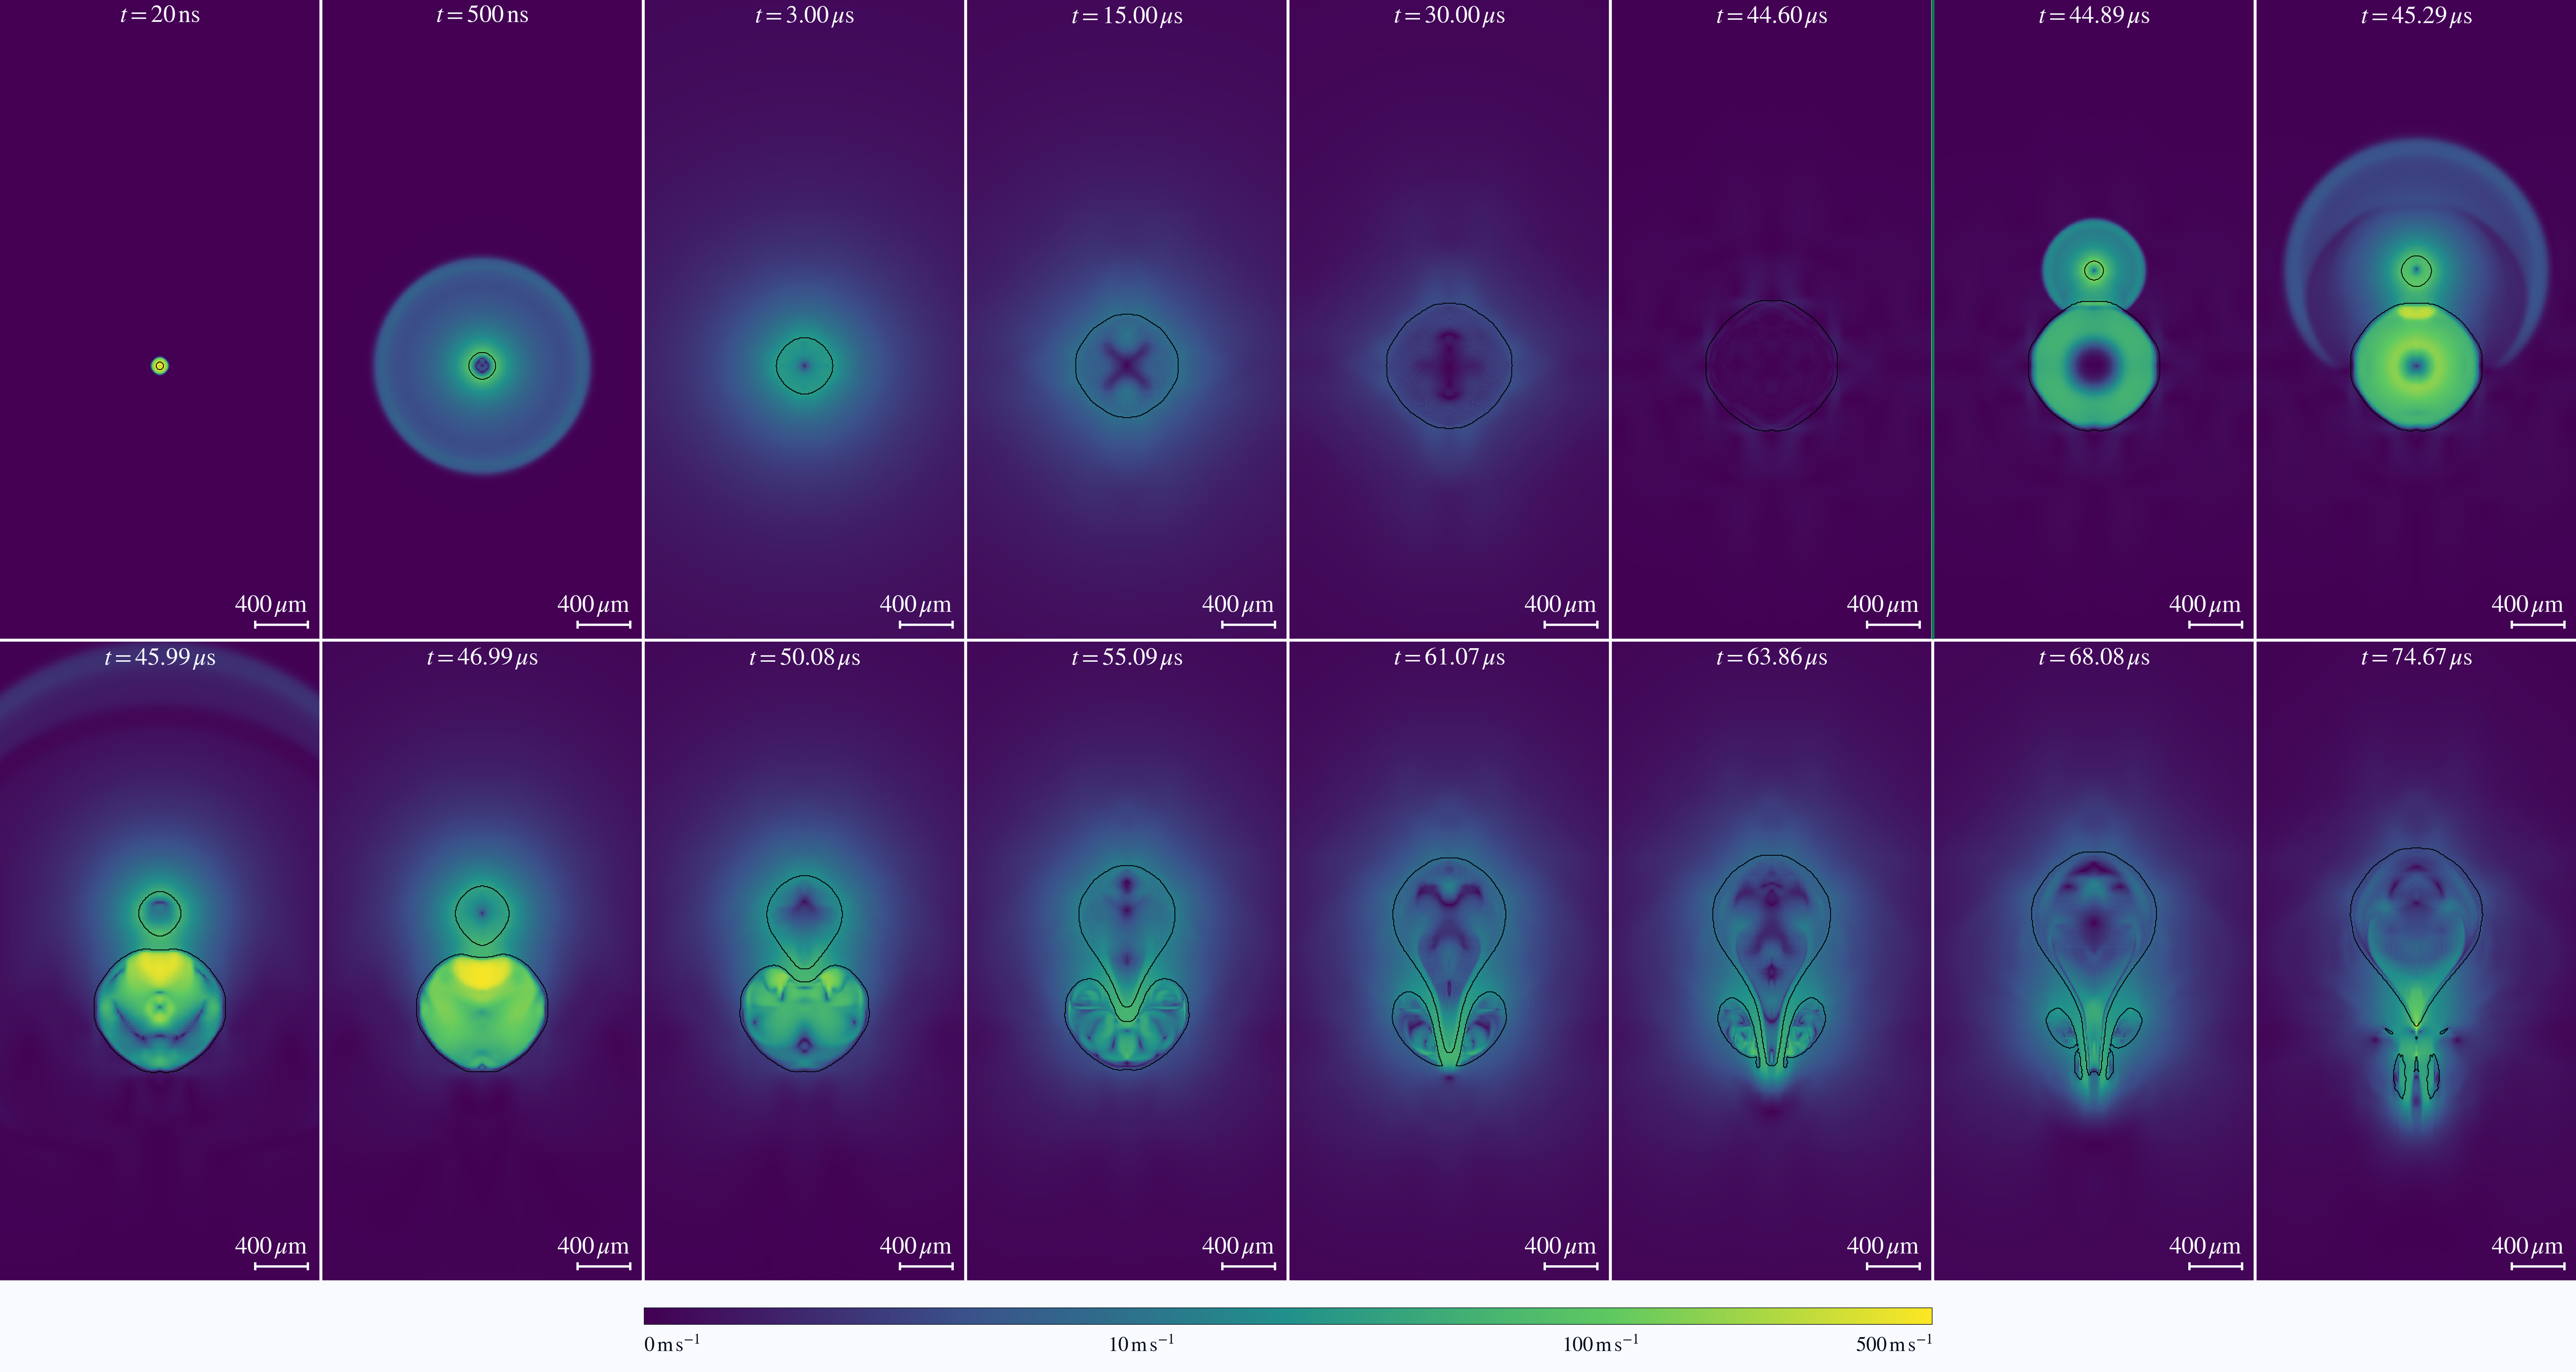
The same selected simulation frames are presented as a synthetic optical recording, numerical schlieren, mixture pressure, and velocity magnitude. Identical timing, orientation, field of view, and 400 µm scale bars allow direct panel-by-panel comparison.

Sixteen-frame synthetic optical visualization of cavitation-bubble-pair evolution
01 · Synthetic optical visualizationVirtual-camera representation of the evolving interfaces.Full resolution
Sixteen-frame numerical schlieren visualization of density-gradient structures
02 · Numerical schlierenFixed logarithmic density-gradient scale with weak background gradients suppressed below 10³ kg m⁻⁴.Full resolution
Sixteen-frame signed-log mixture-pressure visualization
03 · Mixture pressureFixed signed-log scale centered on the 0.1 MPa ambient state.Full resolution
Sixteen-frame logarithmic velocity-magnitude visualization
04 · Velocity magnitudeLogarithmic 0–500 m s⁻¹ mapping reveals both the slower surrounding flow and the emerging high-speed jet.Full resolution

Computational scope

Why the present run ends after neck collapse.

16
CPU cores
<24 h
Total wall-clock time
≈1 ps
Limiting time-step scale

The calculation was performed on 16 CPU cores of a single AMD Ryzen 9 9950X workstation, with a total computation time below 24 hours. As the solution approaches 80 µs, the rapidly accelerating liquid jet drives the stable explicit time step toward approximately 1 ps. Resolving the subsequent dynamics therefore becomes disproportionately expensive, and the present simulation was stopped after neck collapse rather than continued at inadequate temporal resolution.

A future extension would benefit from funded access to a higher-throughput workstation; a large HPC allocation is not necessarily required. A Threadripper PRO 9995WX-class platform, together with suitable GPU resources where supported by the solver, could enable longer integrations, finer spatial resolution, and broader parameter studies.